
Understanding how to read a candlestick chart is essential for anyone interested in trading or investing in the stock market. These charts provide powerful visual insights into price action and market psychology. In this article, we’ll break down the basics of candlestick charts, explain key components, and explore the most common chart patterns—complete with images for better understanding.
The Historical Foundation of Candlestick Charting
Origins in 18th Century Japan
The candlestick charting method traces its roots to Munehisa Homma (1724-1803), a rice merchant from Sakata, Japan, who revolutionized market analysis during the Tokugawa Shogunate period. Homma’s groundbreaking work in the Dojima Rice Exchange in Osaka demonstrated that market prices were influenced not only by supply and demand but also by trader psychology and emotions.
Homma published his insights in “The Fountain of Gold — The Three Monkey Record of Money” in 1755, making him extraordinarily wealthy (equivalent to approximately $10 billion in today’s dollars). His methodology emphasized the psychological aspects of trading, noting that recognizing market sentiment could enable traders to position against prevailing trends.
Introduction to Western Markets
Candlestick charting remained confined to Japan for centuries until Steve Nison introduced these techniques to Western financial markets in the late 20th century. Nison’s seminal book “Japanese Candlestick Charting Techniques,” published in 1991, popularized this analytical method among Western traders and established it as a cornerstone of modern technical analysis
📊 What is a Candlestick Chart?
A candlestick chart is a type of financial chart used to represent the price movements of an asset (like stocks, forex, or crypto) over a specific time period. Each candle shows four major data points:
- Open: Price at the start of the time period
- Close: Price at the end of the time period
- High: Highest price during the period
- Low: Lowest price during the period
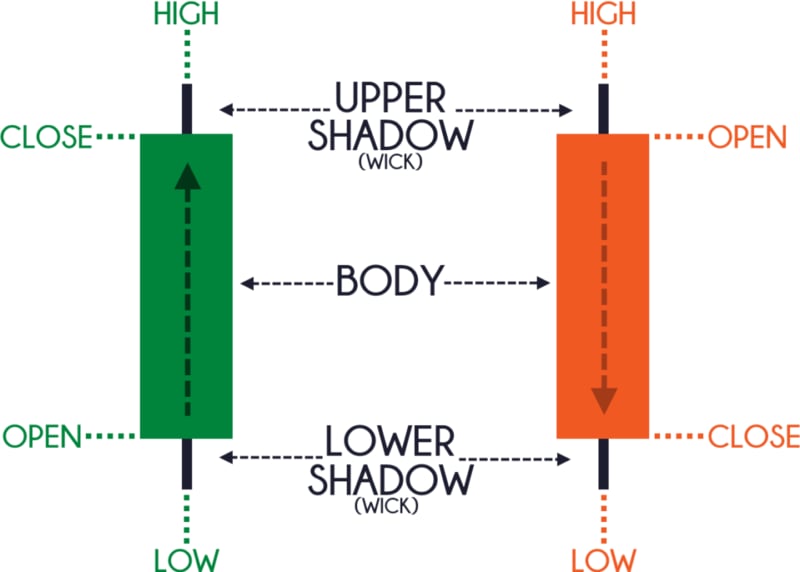
🕯️ Anatomy of a Candlestick
Each candlestick has two parts:
1. The Body
The thick rectangular area between the open and close prices.
- Green (or white) body = price closed higher than it opened
- Red (or black) body = price closed lower than it opened
2. The Wick/Shadow
The thin line above and below the body indicating high and low prices.
Interpreting Price Action Through Candlestick Structure
The relationship between these components provides valuable insights into market psychology. A long body with small wicks indicates strong directional movement with minimal price rejection.
Detailed candlestick chart patterns explained with labeled bullish and bearish candlesticks and common trading patterns
Conversely, small bodies with long wicks suggest indecision and potential trend reversals.
Essential Single Candlestick Patterns
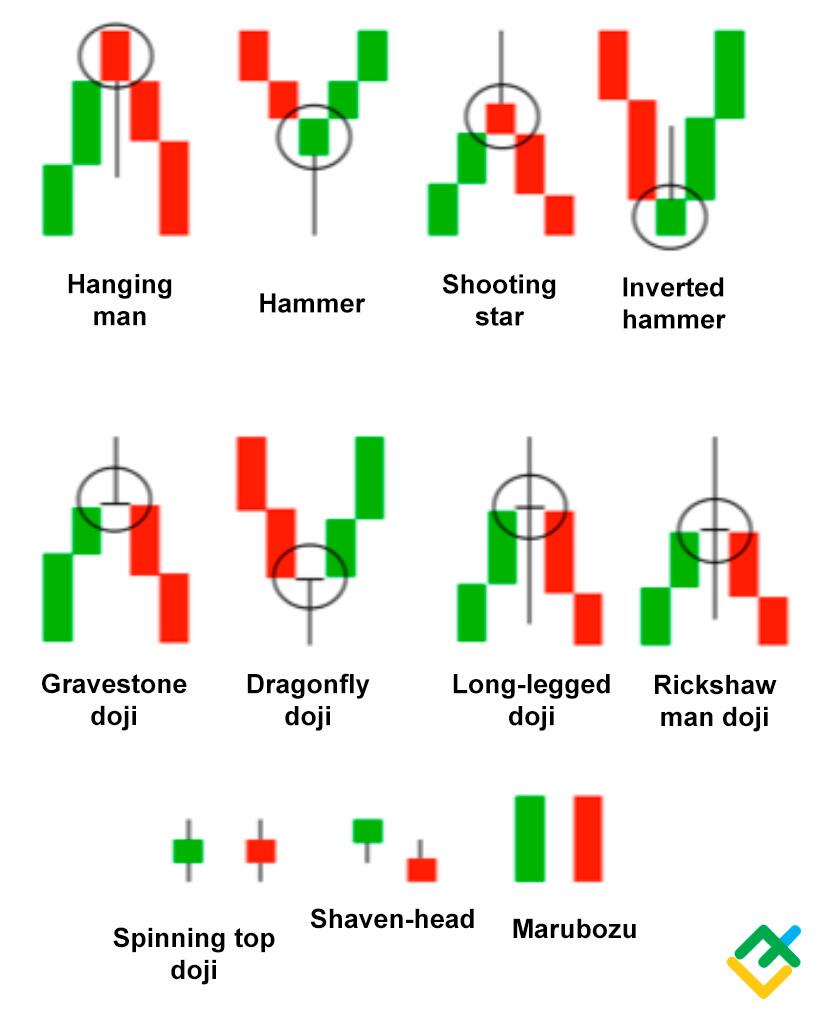
Doji Patterns: Market Indecision Signals
The Doji represents one of the most significant single candlestick patterns, forming when opening and closing prices are virtually identical. This creates a cross-like appearance that signals market indecision and potential trend reversals.
Types of Doji patterns include:
- Standard Doji: Equal-length upper and lower wicks
- Long-legged Doji: Extended wicks showing extreme volatility
- Dragonfly Doji: Long lower wick with minimal upper wick, suggesting bullish reversal potential
- Gravestone Doji: Long upper wick with minimal lower wick, indicating bearish reversal potential
Hammer and Hanging Man: Reversal Indicators
The Hammer and Hanging Man share identical physical characteristics but appear in different market contexts. Both feature small bodies with long lower wicks (approximately twice the body length) and minimal upper wicks.
A Hammer appears at the end of a downtrend and signals potential bullish reversal. The long lower wick demonstrates that sellers drove prices lower, but buyers regained control by the close. A Hanging Man occurs at the end of an uptrend and warns of potential bearish reversal.
Illustration of bearish candlestick chart patterns: Hanging Man and Shooting Star, signaling potential reversals
Shooting Star and Inverted Hammer
The Shooting Star features a small body with a long upper wick, appearing at the top of uptrends to signal potential bearish reversals. This pattern indicates that buyers initially pushed prices higher, but sellers overwhelmed them before the close.
The Inverted Hammer has the same physical structure but appears at the bottom of downtrends, suggesting potential bullish reversals. Despite the bearish appearance, this pattern can indicate that buyers are beginning to challenge seller dominance.
Common candlestick chart patterns including hammer, hanging man, doji variations, and marubozu for reading financial market trends
Multiple Candlestick Patterns
Engulfing Patterns: Powerful Reversal Signals
Engulfing patterns consist of two candlesticks where the second candle’s body completely encompasses the first candle’s body. These patterns represent dramatic shifts in market sentiment and are among the most reliable reversal indicators.
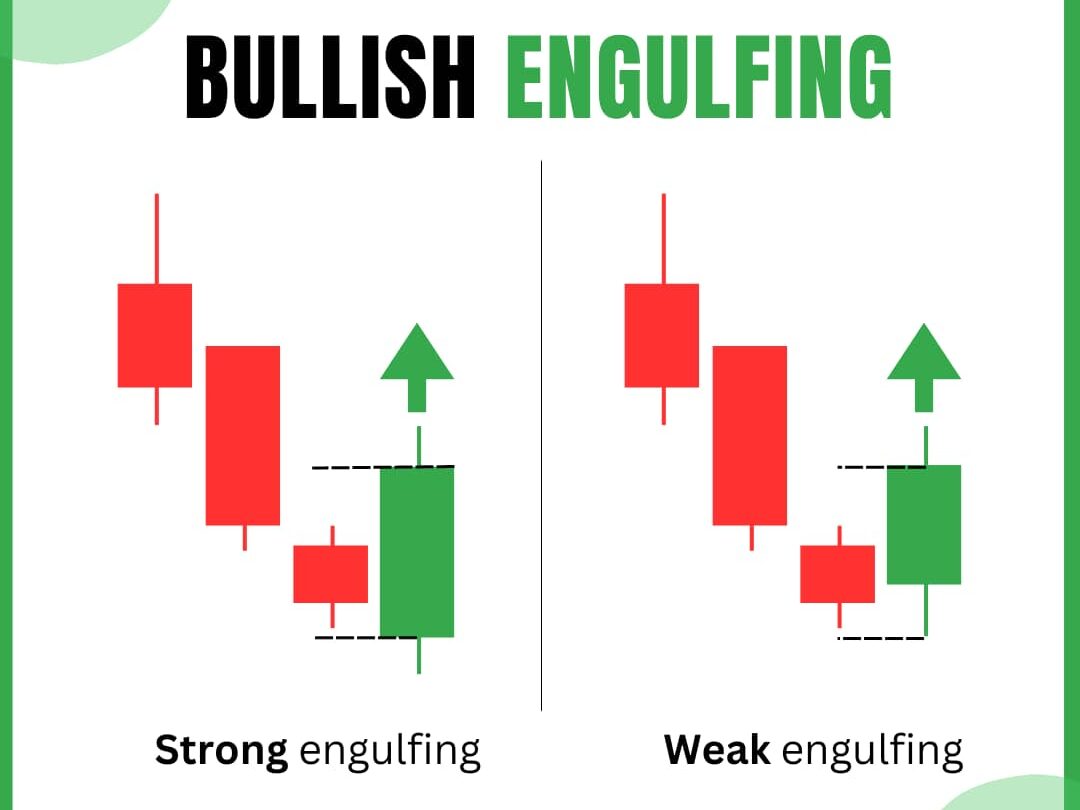
Bullish Engulfing Pattern: A small bearish candle followed by a larger bullish candle that completely engulfs the previous day’s body. This formation indicates that buying pressure has overwhelmed selling pressure, potentially marking the end of a downtrend.
Bearish Engulfing Pattern: A small bullish candle followed by a larger bearish candle that engulfs the previous body. This suggests that selling pressure has dominated, potentially signaling the end of an uptrend.
Bullish engulfing candlestick patterns illustrating strong and weak engulfing signals in bullish market reversals
Star Patterns: Three-Candle Reversal Formations
Morning Star: This three-candle bullish reversal pattern begins with a long bearish candle, followed by a small-bodied candle (indicating indecision), and concludes with a long bullish candle. The pattern suggests that selling pressure is weakening and buyers are regaining control.
Evening Star: The bearish counterpart features a long bullish candle, a small indecision candle, and a long bearish candle. This formation indicates that buying momentum is fading and sellers are taking control.
Harami Patterns: Inside Day Formations
Harami patterns feature a large candlestick followed by a smaller candle that fits entirely within the previous candle’s body. The name “harami” means “pregnant” in Japanese, reflecting the visual appearance of the pattern.
These patterns suggest a pause in the prevailing trend and potential reversal. Bullish Harami occurs when a small bullish candle appears within a large bearish candle, while Bearish Harami features a small bearish candle within a large bullish candle.
Reading Market Psychology Through Candlesticks
Understanding Trader Emotions
Candlestick patterns serve as windows into market psychology, revealing the collective emotions and behaviors of traders. Each pattern tells a story about the battle between bulls and bears, providing insights into fear, greed, and market sentiment.
Fear manifestation appears through patterns like shooting stars and hanging men, where initial price movements are quickly rejected. Greed indicators include patterns like hammers and bullish engulfing, where buyers aggressively bid up prices.
Sentiment Shifts and Market Transitions
The formation of specific candlestick patterns often coincides with significant changes in market sentiment. Doji patterns represent moments of equilibrium where neither bulls nor bears maintain control. These periods of indecision frequently precede major directional moves.
Engulfing patterns capture moments when market sentiment shifts dramatically, with one group of traders (bulls or bears) overwhelming the other. The size and context of these patterns help determine the strength and sustainability of the sentiment change.
Practical Application and Trading Strategies
Confirmation and Context
Successful candlestick pattern trading requires proper confirmation and context. Patterns should be evaluated within the broader trend structure and confirmed by subsequent price action. A hammer pattern at a key support level carries more significance than one appearing in the middle of a trend.
Volume analysis provides additional confirmation for candlestick patterns. High volume accompanying reversal patterns suggests genuine shifts in market sentiment, while low volume may indicate false signals.
Risk Management Considerations
Effective candlestick trading incorporates strict risk management principles. Entry points should be carefully planned, with stop-loss levels positioned beyond the pattern’s key levels. For hammer patterns, stops are typically placed below the low of the pattern, while engulfing patterns use the engulfed candle’s extreme as the stop level.
Position sizing should reflect the pattern’s reliability and market context. High-probability patterns in trending markets warrant larger positions, while lower-probability setups require reduced risk exposure.
Integration with Technical Indicators
While candlestick patterns provide valuable standalone insights, their effectiveness increases when combined with other technical analysis tools. Moving averages help identify trend direction and dynamic support/resistance levels. Relative Strength Index (RSI) and MACD provide momentum confirmation for candlestick signals.
Support and resistance levels add crucial context to candlestick patterns. Reversal patterns forming at significant price levels carry higher probability of success than those appearing in the middle of trading ranges.
Common Mistakes and Limitations
Pattern Recognition Challenges
One of the primary challenges in candlestick analysis is the subjective nature of pattern recognition. While some patterns are clearly defined, others require interpretation and experience to identify correctly. Automated pattern recognition systems often struggle with the nuanced aspects of candlestick analysis.
Time frame considerations significantly impact pattern reliability. Patterns on higher time frames (daily, weekly) generally carry more weight than those on shorter intervals (1-minute, 5-minute). However, shorter time frames can provide precise entry and exit points when properly contextualized.
Market Environment Factors
Candlestick patterns perform differently across various market conditions. Trending markets tend to favor continuation patterns, while ranging markets see higher success rates with reversal patterns. Understanding the current market regime is crucial for appropriate pattern selection and interpretation.
News and fundamental events can override technical patterns, leading to failed signals. Major economic announcements, earnings releases, or geopolitical events may cause price action to deviate from expected candlestick pattern outcomes.
Advanced Pattern Analysis
Combining Multiple Time Frame Analysis
Professional traders often employ multiple time frame analysis to validate candlestick patterns. A reversal pattern on a daily chart gains additional significance when supported by similar formations on weekly charts. Conversely, shorter time frames provide precise timing for entries and exits based on longer-term pattern signals.
Pattern Reliability and Success Rates
Research into candlestick pattern effectiveness reveals varying success rates across different formations. Engulfing patterns and three-candle formations like morning/evening stars typically show higher reliability than single candlestick patterns. However, success rates also depend heavily on market conditions and proper confirmation.
Statistical analysis of pattern performance can guide trading decisions and position sizing. Patterns with higher historical success rates may warrant more aggressive positioning, while lower-probability formations require conservative approaches.
Technology and Modern Candlestick Analysis
Automated Pattern Recognition
Modern trading platforms incorporate sophisticated pattern recognition algorithms that can identify candlestick formations in real-time. These systems help traders scan multiple markets simultaneously and alert them to potential opportunities. However, automated systems still require human oversight to account for market context and confirmation.
Integration with Algorithmic Trading
Algorithmic trading systems increasingly incorporate candlestick pattern analysis as part of comprehensive trading strategies. These systems can process vast amounts of data and execute trades based on predefined candlestick criteria, combined with other technical and fundamental factors.
🔚 Conclusion
Learning how to read a candlestick chart is a game-changer for stock market success. Whether you’re a day trader or long-term investor, candlestick patterns can help you understand market psychology and make smarter trading decisions. Combine this knowledge with discipline, and you’ll gain a solid edge in your investing journey.